shortershifts

There is no such thing as the perfect hockey system. There are many different ways to approach the Xs-and-Os of the forecheck, breakout, power play and penalty kill. Every coach has somewhat different preferences.

It's the attention to detail that matters. key to success, as the late EJ McGuire once summed it up in a 2006 interview, is the B.E.D. principle: buy-in, execution and depth.

McGuire, who passed away in 2011, believed that "statistics should be used the way that a drunk uses a lamppost; for support, rather than illumination." The longtime NHL assistant coach (including two stints with the Flyers), was one of the first to chart players' shift times over the course of a game and throughout the season.

In and of itself, a shift time is just a number. But spread out across the team and through the long marathon-like grind of the season, and it is one of the factors that helps to support (or challenges) the level of buy-in, the efficiency of execution and the genuine level of roster depth.

A tried-and-true hockey equation: Shorter shifts + more frequent line rolling + increased puck possession = Less time spent hemmed in your own zone, faster recoveries between shifts and, hopefully, a fresher team come the third period.

Let's apply these principles to the 2019-20 Flyers. This season, the Flyers have scored 87 third period goals (3rd most in NHL) and allowed just 61 GA (5th fewest) in the 69 games they played before the NHL schedule pause.

Taking a look at the underlying team numbers, the average shift time last season per Flyers forward was roughly 44 seconds. This season, it's about 41 seconds.

A three-second difference may not sound like much. In a small sample size, it isn't. Over a larger sample size, however, it's a significant difference.over the course of the season.

For one thing, when spread out across full games, it means more ability for to roll lines.Last season, the Flyers forward corps averaged 18.2 shifts per game (led by Sean Couturier's 26.8 with 8 averaging 20+). This year, 10 Flyers have averaged 20+ shifts and 13 players have averaged 19+ minutes. In 2018-19, the Flyers had 8 forwards average 14+ minutes TOI. This season, 10 different Flyers forwards have averaged at least 14 minutes of ice time.
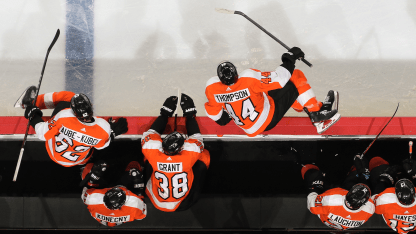
Additionally, last year, the Flyers had seven forwards on the individual plus side of the unblocked shot attempts (Fenwick) measure of puck possession at 5-on-5. This year, it's nine with two others at 49-plus percent.

These improvements are a product of the team's improved depth up front as well as head coach Alain Vigneault's commitment to spreading the wealth.

First, let's look at the Flyers' average time on the ice per shift and average number of shift per game by comparing the 2018-19 season to the current year. If you take all Flyers forwards who appeared in at least 15 games last season or this season. eight of the 10 lengthiest average shifts per game on the roster were from last year's squad.

This year, only two Flyers forwards have averaged 46 or more seconds per shift: Couturier at 46 seconds (he averaged 50 seconds last season) and Travis Konecny at 46 seconds (45 last year). Team captain Claude Giroux is at 43 seconds this year, whereas he averaged 49 seconds a year ago. Jakub Voracek has trimmed an average four seconds per shift (49 last year to 45 this year).

What does this suggest? It is one data point that helps support the level of buy-in from the team's veteran group to what Vigneault has established as a non-negotiable part of playing for his team: Skate energetic, but shorter shifts and then get off the ice so fresh troops can get on the ice.

There is also an execution component to the data. There are times where line changes are either not possible -- such as lengthy shifts hemmed in the defensive zone or after your team is called for icing -- or not advisable (based on where the puck is and when your defensive pairs are going for their own shift changes).

On the flip side, when you have defenseman executing good first passes, the forwards are effective at helping to clear the zone and when the forecheck is clicking, it means more opportunity to control the play and roll lines with more frequency. Sure enough, the 2019-20 Flyers have seen a significant bump in the number of line change opportunities per game.

Take Giroux, for instance. Although his average time on ice per shift is down a full six seconds, he's averaged basically the same number of shifts per game (in 2019-20 (26.3) as he did last season (26.1); actually, it is very slightly higher.

Couturier is still pulling down an average 26.0 shifts per game; practically the same as last year (26.8), while the extent of Voracek's usage by Vigneault this year (22.7 shifts) is also virtually identical to the reliance that Dave Hakstol and Scott Gordon (22.8) placed upon him. James van Riemsdyk's shift times are down from an average 49 seconds last year to 44 this season but his average number of shifts are essentially identical (20.3 in 2018-19, 20.2 this season).

Meanwhile, as you move down the forward lineup, that's where you find the most significant differentials in shift time efficiency vs. shift volume.

For example,during their respective time with Philadelphia last season, Jordan Weal averaged 45 seconds per shift and Ryan Hartman averaged 48 seconds. This year, Tyler Pitlick has averaged 39 seconds per shift and Nicolas Aube-Kubel has averaged 40 seconds.

Simultaneously, Pitlick's average 18.4 shifts per game, while Hartman (the player for whom Pitlick was traded) averaged 15.2 shifts and Weal had the same frequency of usage (18.4 shifts) as Pitlick. An NHL rookie this season, Aube-Kubel has averaged 17.1 shifts per game.

Prior to his Ewing Sarcoma diagnosis, Oskar Lindblom was the Flyers' player who saw the biggest expansion of his role. He went from 18.9 average shifts per game last year (less than 16 per game before Gordon became interim head coach and bumped up his usage) to 25.4 per game under Vigneault. Meanwhile, the Swedish forward's average time on ice per shift went down an average two seconds (44 to 42) per shift.

Scott Laughton has averaged 20.7 shifts per game this season to 20.3 last year but he, too, has trimmed his shift times by an average of two seconds (44 seconds to 42 seconds). Meanwhile, since joining the Flyers, Derek Grant has averaged 20.6 shifts and 42 seconds per shift.

In other words, in his first year as Flyers head coach, Vigneault has gotten team-wide buy-in to increased discipline in shift times. Players do so because they're still getting as many -- or even more -- shifts than they did before.

These are not the only factors involved, of course. Even so, the combination of improved shift discipline and improved depth have helped contribute to the bigger picture of a Flyers team that has allowed fewer goals and fewer odd-man rushes due to tired players getting caught on long shifts.