Head coach Dave Hakstol saw Gourde's impact too.
"(Gourde) brought a real boost to our lineup," Hakstol said post-game. "He brings life on the bench. He brings the exact same thing on the ice.
"He was a productive guy out there. He made some plays, he created a lot of O-zone time and did a great job with two linemates that he's never played with before."
Gourde certainly contributed to his team in his first game back, but should we expect that to continue? Part of what's interesting about this Kraken team is watching how players evolve in what may be a new and or different role compared to the team from which they came.
After all, where a player played, who they played with and when they played all have to be part of a how a player is measured, right?
Well, the answer is: maybe.
Let's dig in.
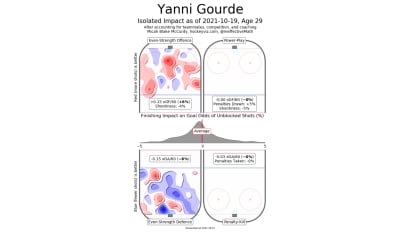
Over at HockeyViz.com, Micah Blake McCurdy has mathematically developed a way to isolate and measure a player's individual impact. He accounts for a player's teammates, competition and coaching and then distills out where and how a skater drives play.
So let's take a look at Gourde's overall impact through this lens.
In the visualization above, we look at a player's offensive impact in the top two rink images (even strength and power play), and then we examine their defensive impact in the bottom two (defense and penalty kill). In each image, red marks areas of the ice where offense (shots) is coming from at a rate greater than league average, while blue marks areas where creation rates are lower than league average.
For both colors, the darker it is, the bigger the impact.
Given these definitions, you want to see more red in the offensive charts (a player is driving offense at a rate higher than average), and in the bottom charts you want to see more blue (a player is suppressing their opponent, meaning shots against are happening less than average).
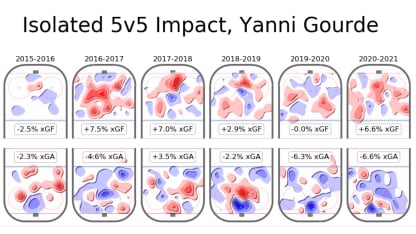
Here's how Gourde measures out.


