AnaylticsWithAlison_2568x1444 (1)

When it comes to data and measuring things, you all know I'm a big fan. But, I'm also a big fan of getting things as accurate as possible and acknowledging the limits of the public data that we have in the game of hockey today. So, it was music to my ears when our elite broadcasting crew of John Forslund and JT Brown came to me with questions about some numbers after a recent Kraken game. What their very knowledgeable eyes saw didn't match how the game measured out and they wanted to understand why.

So, we decided to do a test. Bundled by GEICO, for one game, (San Jose at Seattle, Apr. 29), Brown would track what he deemed legitimate Kraken scoring chances. And then, we'd match that up with what public data said.
Let's dig in.
First, it's important to understand what Brown was looking for. He didn't include blocks where a shooter was trying to fire a puck through a defender (smart!), nor did he include chances against an empty net (again, smart!). He did evaluate what kind of shot came out of a chance (not just location or even what set up the chance), and put just as much weight on the situation as the shot itself. For Brown, "situation" includes time and space for the shooter as well as what the shooter is facing in terms of opponent pressure (be it location, or number of bodies).
Brown identified 14 scoring chances in total across all situations of play. They came off the sticks of 10 different players. Two were goals, nine were shots on goal, one was a shot that rang off the post, and two were misses. He had five scoring chances in each of the first two periods and four in the third (remember, he excluded empty-net attempts).
Now let's look at how those chances stacked up against some of the most commonly used data points.
Scoring Chances
As we've discussed, scoring chances can be defined differently (particularly within teams themselves). For this exercise, we used the model employed by NaturalStatTrick.com and developed by War-On-Ice.com (full write up
HERE
).
The count (all situations) for the
San Jose-Seattle game
was 31. So, a little more than twice Brown's count.
While the game total was different, this stat aligned with Brown's evaluation exactly for Alex Wennberg, and was just one off for Adam Larsson, Jared McCann, Morgan Geekie, and Ryan Donato (Natural Stat Trick had each player earning one more than Brown counted).
So, here, for a number predicated on shot location and type, Brown's insight says that the number of actual scoring chances decreases when we place each shot attempt within the context of what our eyes can see. That makes sense! Let's go further.
High-Danger Scoring Chances
We hear about "high-danger areas" all the time (including from me!). These are the attempts that are supposed to be fought for and the most likely to turn into goals. How did the numbers match up here?
Natural Stat Trick had Seattle earning 12 total high-danger looks (again, Brown's count was 14). For this comparison, we looked at the shot location data as provided by the NHL and published by HockeyViz.com.
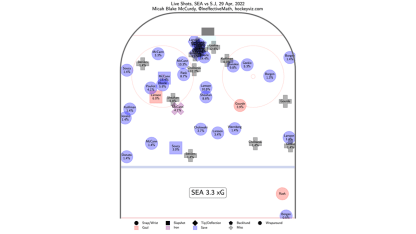
SEA-SJS live shots

If we match the chances Brown identified to what occurred in the high-danger areas, four of Brown's came from the area close to the net, but 10 did not!
A great example of what this measure might not capture is Larsson's goal.

Brown defined that as a scoring chance, but it originated from outside the high-danger areas. So, a good lesson here. If we look just to "high-danger chances" to tell us the kind of offense a team is generating, we miss chances like the one that resulted in the second goal of the game. We also might "gain" some chances based purely on location alone. About that…
Expected Goals
That brings us to expected goals. This measure (we're using the Evolving-Hockey.com model) is supposed to help alleviate some of the questions around location-based analysis by
applying more "value" to every shot attempt taken
. And here's where it gets interesting.
If we sort all shot attempts by value (expected goals) in descending order, and identify each attempt that was also one of Brown's scoring chances, six of Brown's fall within the top 10 as measured by shot quality. That's pretty good, especially when you consider the top two shots by value were both against an empty net and Brown didn't include those (again, smart because, as Luke Younggren of Evolving Hockey explained, an empty net automatically skews their model enough that empty-net attempts shouldn't be "read into.")
In fact, all 14 of Brown's scoring chances ranked in the top 25 shots as ranked by shot quality. Considering the limitations of the data we can use to define shot quality, that's a solid showing for the measure itself.
But what about the attempts that came in the top 10 that DIDN'T earn Brown's designation. We sat down and looked at those together.
Here's the most dangerous shot (non-empty net) per Evolving Hockey. It came off Yanni Gourde's stick in period three.

"When I look at this play, I look at where (Gourde) is, yes, but he's hampered by the defender and isn't able to get a quality look," Brown says. "The puck is already against (Kaapo) Kahkonen's pad. I read this one as not a real scoring chance.
"Usually in this location, it's a back door tap in. This is a very different situation. The location? Sure you'll score a high percentage of goals from there, but this sequence doesn't fit that scenario."
Brown and Evolving Hockey both earmarked the next three as high-quality chances. The fifth best look came from Karson Kuhlman.

"Again, the location is there, but Kuhlman's stick is lifted the entire time," Brown said. "It's also hard to tell what the puck hits, but it hits one of the two players in front and goes to the corner. To me that's a pass to the slot that didn't make it."
The final top 10 chance that didn't match Brown's list was by Jordan Eberle late in the third period.

"(Eberle) is in the right spot," Brown said. "If he had space and could do what he wanted to do and get a shot off, he would more than likely put it in the net. But because of what he had to deal with, and the three checkers there, (Eberle) wasn't able to put a quality shot towards the net. If he was all alone, this is 100 percent a different situation."
Summary
All in all, about half of the chances the data identified made it through Brown's analysis as quality chances. That's not too bad considering the limits of what we have available to us publicly. Interestingly, too, if we look at the big takeaways from each analysis, similar lessons emerge. Who had the most chances? Both the data and Brown say McCann did. Who were other top offensive players, both sources again agree on Gourde, Wennberg, Donato and Larsson.
None of this was meant to say any stat is abjectly wrong. Public analytics have brought - and continue to bring - great insight to hockey. This exercise was more about enriching our understanding of the game and what data can - and CANNOT - tell us. If we want to use data, we need to understand it's limitations. And even as data matures, this is an important reminder that it's hard to imagine the value of what our eyes see ever NOT being an essential piece of evaluation.
"I don't want people to think I'm saying the data is wrong," Brown said with a laugh. "I acknowledge I'm a tough grader. This is how I see the game and it may be different than another player, coach, or analyst. But this is how I look at scoring chances. I put myself in the shooter's shoes and think about how I would feel if I did or didn't bury that chance."