ebs-mccann

The memory is still clear as day for me. Years ago, a group of us were looking at an NHL player's career stats. On paper, each year was represented by one line with traditional numbers reading left to right: goals, assists, total points.
Each line presented a very different number than the one before or after it and thus the question quickly emerged: "What or who is this player? Is he the player who scored 30 goals or the player who did not?"
What bothered me as I looked at these totals in stark contrast to one another is they didn't account for (among other things) the fact the player had missed a large chunk of games in one season due to injury. You can't hold it against someone for not scoring if they aren't even on the ice, right?
It felt like there had to be a better way to determine player evaluation, and thus my journey into using "rate stats" began.
Let's dig in.

In any given season, the amount of time a player sees the ice can vary. This can be due to everything from total time a player is deployed in a game, to what kind of game situations a player plays in, to the number of games a player plays (due to lineup decisions or health).
A straight point total includes none of these variables. It can put us at risk of assuming a player with more points is "better" than one with fewer.
But that's limiting our evaluation. So, the quickest way to level the playing surface is to "rate" any stat. This means we take a player's total in any measure, divide it by the player's total ice time, and multiply by 60. If you've seen people use "Per 60," this is exactly what has happened.
So now, with rate stats, we are looking at how any player performs independent of how much time they did or did not play. We can start to answer the question "what did a player do in the ice time they were given?"
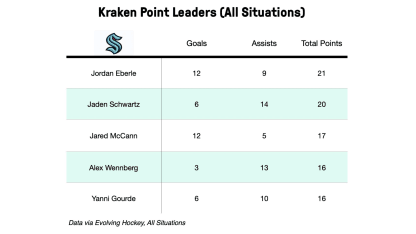
As an example, here are the top five Kraken players by points scored (all situations).

awa1

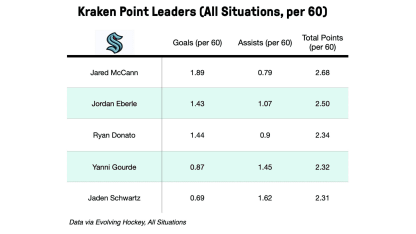
These are all players we know to be part of the core of the Kraken offense and their stat lines rightly reinforce that. But, only Alexander Wennberg has played in all 30 of Seattle's games thus far this season. What happens if we look at scoring production per 60 minutes of play?

awa2

When we look at points per 60 minutes of play, there's certainly some moving around of names and Ryan Donato jumps into the mix.
To be very clear, the differences between these two lists don't mean one player "isn't as good" as their point totals. It's just a way to look at how players make use of the time they are given. It's also important to note that while we chose points as our example, there are many ways a player can add value - shot share, faceoffs, saves, blocked shots, completed passes. We didn't include those here. The bigger lesson is we need to be aware of when we are comparing totals and when we are comparing rates and the meaning behind each.
One word of caution with rate stats. Because they break measures down to what happened in minutes played, often, it's easy to fall into the trap of "look at this player producing so very much! This player should be put somewhere else in the lineup - they'd produce even more!"
But minutes played doesn't just relate to how much time a player was on the ice, it also relates to deployment: what line is a player on; what role are they being asked to fulfill. Getting the most out of players isn't about just giving them ice time, it's about giving them the "right" kind of ice time so their skills can be maximized.
To that end, it can be valuable to look at a stat "per games played" instead of per 60 minutes of play. In this case, any stat's total is simply divided by the number of games in which a player saw action. While perhaps less commonly used, this type of rate stat allows for the impact of factors such as spot in the lineup, plus situational play.
At the end of the day, don't think point totals matter. Goals win games, of course.
But if we want to understand player performance both within a career or teammate to teammate, we need to find a way to level the playing surface that accounts for differences in ice time. Rate stats help us get the job done.