So, we decided to do a test. Bundled by GEICO, for one game, (San Jose at Seattle, Apr. 29), Brown would track what he deemed legitimate Kraken scoring chances. And then, we'd match that up with what public data said.
Let's dig in.
First, it's important to understand what Brown was looking for. He didn't include blocks where a shooter was trying to fire a puck through a defender (smart!), nor did he include chances against an empty net (again, smart!). He did evaluate what kind of shot came out of a chance (not just location or even what set up the chance), and put just as much weight on the situation as the shot itself. For Brown, "situation" includes time and space for the shooter as well as what the shooter is facing in terms of opponent pressure (be it location, or number of bodies).
Brown identified 14 scoring chances in total across all situations of play. They came off the sticks of 10 different players. Two were goals, nine were shots on goal, one was a shot that rang off the post, and two were misses. He had five scoring chances in each of the first two periods and four in the third (remember, he excluded empty-net attempts).
Now let's look at how those chances stacked up against some of the most commonly used data points.
Scoring Chances
As we've discussed, scoring chances can be defined differently (particularly within teams themselves). For this exercise, we used the model employed by NaturalStatTrick.com and developed by War-On-Ice.com (full write up
HERE
).
The count (all situations) for the
San Jose-Seattle game
was 31. So, a little more than twice Brown's count.
While the game total was different, this stat aligned with Brown's evaluation exactly for Alex Wennberg, and was just one off for Adam Larsson, Jared McCann, Morgan Geekie, and Ryan Donato (Natural Stat Trick had each player earning one more than Brown counted).
So, here, for a number predicated on shot location and type, Brown's insight says that the number of actual scoring chances decreases when we place each shot attempt within the context of what our eyes can see. That makes sense! Let's go further.
High-Danger Scoring Chances
We hear about "high-danger areas" all the time (including from me!). These are the attempts that are supposed to be fought for and the most likely to turn into goals. How did the numbers match up here?
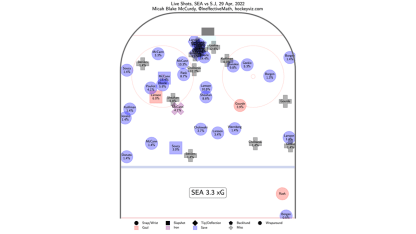
Natural Stat Trick had Seattle earning 12 total high-danger looks (again, Brown's count was 14). For this comparison, we looked at the shot location data as provided by the NHL and published by HockeyViz.com.
