We call all of this activity "transitional play," and it includes events like zone exits (getting out of your defensive zone) and zone entries (getting into the offensive zone). Historically, the most common ways to analyze exits and entries is by volume (how many) and by success rate (did you get to where you wanted to go with possession of the puck?).
But now over at
HockeyViz.com
, Micah Blake McCurdy has added a new wrinkle. His work on
Blueline Transversals
looks at how quickly players create or allow transitional play and the overall impact that has on advancing the puck for their team. How does understanding that help us?
"The way teams are playing now it's so dynamic," Vince Dunn said. "Offensively you can create all the way from your own end. It's about finding that first play to get (the puck) to the forwards or to get it moving ahead and finding your ice to jump in the play."
So how do Kraken players contribute to speeding up or slowing down transitional play?
Let's dig in.
First, it's important to remember that the ask of every player on a team is different. So how a skater performs in each of these measures isn't an evaluation of the player overall, it's a look at how they perform a certain task within the role given to them by the coaching staff.
"We have to structure (the design of offensive transitional play) to the makeup of our lines," Dave Hakstol said. "We have a couple lines we want attacking with possession when it's given…(and we have a) couple lines looking (to) forecheck and looking for opportunity off of that."
Given that context, let's start with where Hakstol was focused, offensive transition. Using McCurdy's work, that's exit offense (leaving your defensive zone) plus entry offense (entering your attack zone).
Offensive Transition
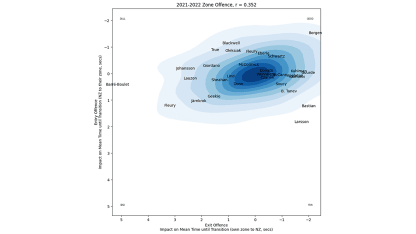
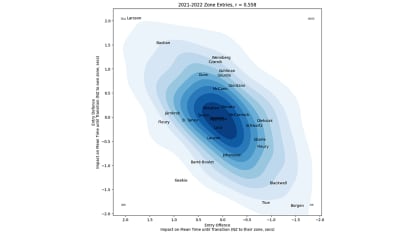
In the visual below from Hockey Viz, the blue shading represents the distribution of all NHL skaters. Then, the Kraken skaters are marked by name as to where they fall within that. Each axis is "time" with the X-axis representing getting out of the defensive zone into the neutral zone, and the Y-axis representing getting into the offensive zone. The smaller the number (including negative values) the faster you are compared to league average.


