082317ThorntonPavelski1

NHL.com is providing in-depth analysis for each of its 31 teams throughout August. Today, three key statistics for the San Jose Sharks.
SHARKS 31 IN 31: [Season preview | 3 Questions | Fantasy breakdown | Top prospects]

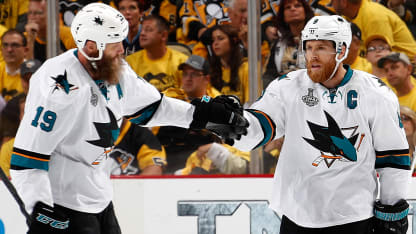
That success largely was because of their two top forwards, Joe Thornton and Joe Pavelski. During the past six seasons, the Sharks outshot their opponents 6,679-5,188 with Thornton on the ice (SAT differential of plus-1,491, seventh in NHL) and 6,754-5,568 with Pavelski on the ice (plus-1,186, ninth).
San Jose's share of shot attempts with Thornton on the ice was 56.28 percent compared to 50.08 percent without him. His plus-6.2 relative SAT% was seventh among those to play at least 100 NHL games in that time span. Pavelski was 40th (plus-4.2).

2. High-paced hockey

There's a statistic in basketball called Pace Factor, the number of possessions each team averages in a 48-minute game. In hockey, the equivalent statistic is calculated by counting the average number of shot attempts per 60 minutes of play.
From this perspective, the Sharks are considered a high-pace team. At 5-on-5, they averaged 58.21 shot attempts per 60 minutes and allowed 55.65 last season, for an average Pace Factor of 56.93, which ranked seventh in the NHL, according to Natural Stat Trick.
The Sharks play at an even higher pace on special teams. Last season, they averaged 101.08 shot attempts per 60 minutes on the power play and allowed their opponents 107.36 shot attempts per 60 minutes while shorthanded, for an average Pace Factor of 104.22, which ranked fourth in the NHL.

3. Different defensemen, different assignments

The Sharks signed defenseman Marc-Edouard Vlasic to an eight-year, $56 million contract extension ($7 million average annual value) on July 1, according to CapFriendly.com. By the start of next season, San Jose will have $15 million in NHL salary cap space reserved for its top two defensemen, Vlasic and Brent Burns, who begins an eight-year, $64 million contract ($8 million average annual value) this season.
Coach Peter DeBoer deploys Vlasic and Burns in a diametrically opposed fashion, with Burns used more offensively and Vlasic more defensively.
Burns led Sharks defensemen last season (minimum five games) with an offensive-zone start percentage of 58.33. Vlasic (45.00) and regular partner Justin Braun (42.91) were the only Sharks defensemen with offensive-zone start percentages below 50.0.
On special teams, Burns led Sharks defensemen with an average of 3:35 per game on the power play, and Braun (2:07) and Vlasic (2:04) were the top two in shorthanded ice time per game.
Vlasic's most common opponent last season was Edmonton Oilers center Connor McDavid, who won the Art Ross and Hart trophies. Vlasic faced McDavid for 59:46 of ice time in five games, according to Natural Stat Trick. For Burns, it was Anaheim Ducks center Ryan Kesler, who usually plays against the opposition's best offensive players. Burns was on the ice against Kesler for 52:04 in five games.