Gibson vs. Jones

Goaltending is an integral part of the Stanley Cup Playoffs. To better understand the strengths and weaknesses of each goaltender, the last 100 goals allowed for each were charted, with the help of Double Blue Sport Analytics from Upper Hand Inc., to see what patterns emerge.

RELATED: [Complete Ducks vs. Sharks series coverage]
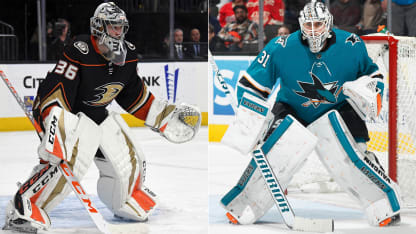
San Jose Sharks goalie Martin Jones was below his .916 NHL career save percentage with a .915 this season facing plenty of high-quality scoring chances. Anaheim Ducks starter John Gibson, who could be a Vezina Trophy finalist as the NHL's top goalie after a season when he had a .926 save percentage, faced similarly tough chances. Each has been widely praised for his calm demeanor, but their styles are notably different.
Jones and Gibson will oppose each other in the Western Conference First Round, which starts with Game 1 at Honda Center on Thursday (10:30 p.m. ET; SN360, TVAS2, USA, PRIME, NBCSCA).
Here is an in-depth look at each goalie's game:

John Gibson, Anaheim Ducks

Injuries slowed him at times, a trend in his that included missing the final three games of the regular season with an upper-body injury. Even with veteran backup Ryan Miller having a .928 save percentage in 28 games and winning the last four games of the season to get the Ducks home-ice advantage over the Sharks, there was never any question Gibson would start Game 1 if healthy. More reliant on impressive raw skill than technique, Gibson has been spectacular for long stretches this season.

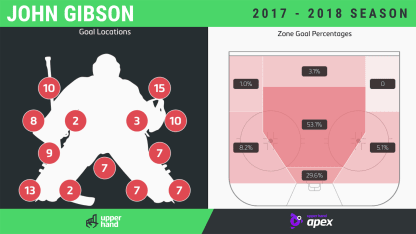
Gibson 2017-18 goal tracking graphic
GOAL TRENDS

Lateral attacks: It isn't a save percentage, so it isn't reflective of Gibson's abilities, but the fact that 48 percent of the goals tracked involved a pass or play across the slot line, an imaginary line splitting the offensive zone from the goal line to the top of the face-off circle, says something about the high quality of chances he faced this season. Inherently more difficult because they force the goalie to change angle from one side to the other, that is 14 percent higher than the average. Add in another 17 goals that involved a lateral adjustment on the same side of the ice, and it seems clear that getting Gibson moving is a big part of beating him.
Sliding across: One noticeable trend on these plays was how often Gibson slid across on his knees laterally on passes close to the top of the face-off circles, an area where a lot of goalies would try to beat plays up on their skates. Even though he beat most of the plays across, the sliding created more exposure high and gave shooters a chance to pull the puck back the other way, which played a role in the 19 against-the-grain goals, where the goalie is caught moving one way and the puck is either shot or pulled back in the other direction.
Numbers that jump out: The biggest number on Gibson's chart may be high glove, but that doesn't mean he has a bad glove hand. These numbers aren't save percentages and there are plenty of examples that Gibson can make glove saves with the best of the NHL.

Martin Jones, San Jose Sharks

Jones' calm demeanor off the ice and style on it are a perfect match. His patient, controlled game rarely takes him far beyond the blue ice, challenging only when he reads a clean chance. Jones is less likely to end up sprawled out than Gibson, but don't confuse his efficiency for a lack of battle. Jones works hard to make sure he doesn't become overly reliant on his strong technical foundation and knows how to get outside the butterfly box when needed.

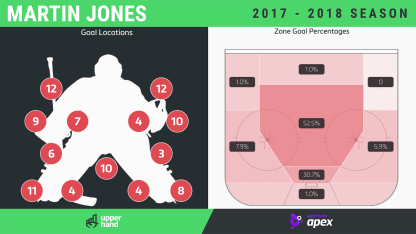
Jones 2017-18 goal tracking graphic
GOAL TRENDS

5-hole: Jones' 18 goals between the pads came on a variety of different kinds of scoring plays, but one stood out. On screened shots from the point, which accounted for 23 of the 100 goals tracked on Jones, who at 6-foot-4 prefers to try to look up and over the traffic in front of his net. When you combine that with a tendency to pull back as he drops into a butterfly rather than driving forward and down, it creates some openings under the pads that led to goals on low shots that got through that traffic in front.
Left to right: Most goalies have one direction they move better, but not all as readily evident as Jones. Like most goalies, he is better to the glove side, but his movement to the blocker lacks the same early rotation. That creates flat pushes parallel to the goal line that used to leave him chasing plays past his post and stranded outside his crease more when moving right. There seemed to be a lot fewer instances of it this season, but the 23 mid- and high-blocker goals and seven under that arm are above the averages and sometimes a function of those issues.
Sharp angles: Jones uses a variety of post-integration techniques depending on the type of attack and its proximity to the goal line, hasn't traditionally lingered in any of them too long, and got beat twice from during his run to the Stanley Cup Final in 2016. But he gave up 11 goals from near or below the goal line this season, and 33 goals on low-high plays, so it will be interesting to see if the Ducks try to attack what has traditionally been an area of strength from bad angles.
Tightening up: It was surprising to see 20 goals under the arms last season, but things were tighter this season, with four getting between his body and the glove-side arm. That's more what you expect from a goalie who has shown good, active hands when needed, but typically relies on positioning and patience to force opponents to beat him with perfect shots.
Numbers that jump out: There aren't many extremes, which isn't surprising given Jones' well-balanced approach, but his 29 against-the-grain goals are almost double the average.