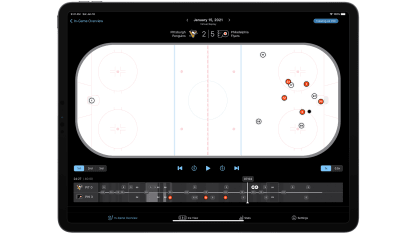
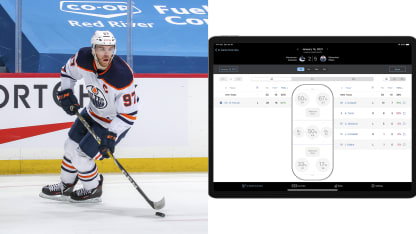
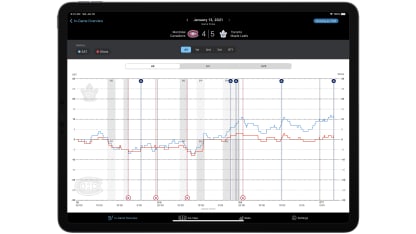
For example, coaches can define the "home plate area" based on what they consider the high-danger area in front of the net, generally the shape of home plate in baseball. They can see the percentages of shot attempts each team makes in those areas as they rise and fall during the game.
Tippett looks at "Game Pulse" after games.
"Sometimes it's crazy," he said. "You think, 'Well, we were playing poorly,' and then you look at that, and you go, 'You know, I think we're all right.' Other times, you think you're playing well, and all of a sudden, you look at that and go, 'We weren't quite as good as I thought we were.' "
The NHL installed Puck and Player Tracking in each of its 31 arenas this season.
The NHL detected a manufacturing issue on the external layer of the tracking puck in the opening week and removed it. The puck is being tested, and the NHL hopes it will return this season. When Puck Tracking is fully operational, the app will show puck zone time and "Virtual Replay," a dynamic whiteboard that displays the puck and players as animation motion graphics.
Player Tracking has been fully operational all season, with players wearing sensors in their jerseys. It has been providing coaches with players' speed, including distance traveled, average speed 5-on-5 and max speed 5-on-5, but they're still figuring out what the data mean. For instance, is distance skated a better indicator of workload than ice time?
"This is a brand-new world," Foster said. "These are metrics that clubs have not used, and we are just scratching the surface here. And so, from a League standpoint, it's, 'Let's get this information to the clubs, do it in a way that's digestible. We'll get the feedback.' But how are they going to use it? That's when it gets really interesting, and how we're going to build on top of that."
This is only Version 3.0. Just wait for 4.0 and beyond.


