SAN JOSE --The 2019 Honda NHL All-Star Game paused for commercials Saturday. On a headset in an NBC Sports truck outside SAP Center, producer Stephen Greenberg spoke to analyst Keith Jones.
"Let me show you something, Jonesy," Greenberg said. "Take a look at your monitor."
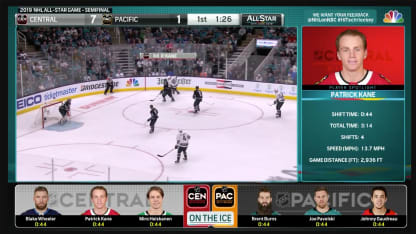
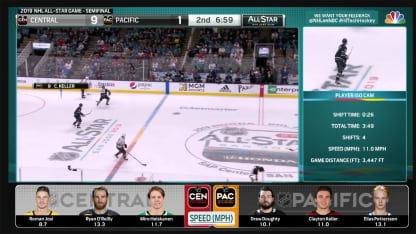
From his perch in the press box, Jones watched replays enhanced with data and visuals from the NHL Puck and Player Tracking system.
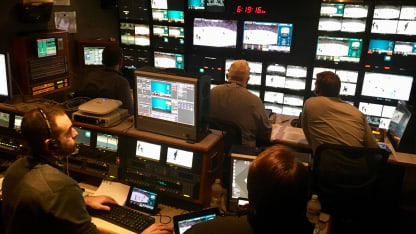
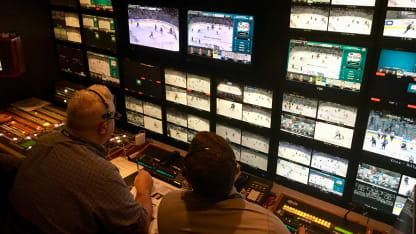
The inside of the truck looked like NASA Mission Control, packed with screens, switches and buttons, and as NBC came out of the break the crew counted down as if this were a rocket launch.
"Three …
"Two …
"One …"
Just like that, Jones used the new tools to give viewers better insight.
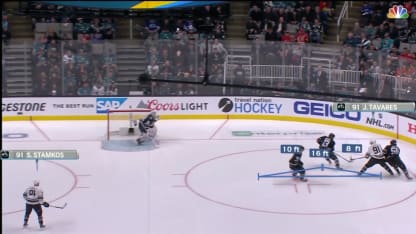
A gray trail showed the path of the puck as defenseman Seth Jones and center Jack Eichel finished pretty passing plays. A blue triangle showed the distances between players who bunched up defending center John Tavares, while another center wearing No. 91 went to the net.
"Watch the defensive coverage here," Jones told the audience. "Three Metropolitan players on one side, very close to each other, and that leaves this guy, Steven Stamkos, to go to work and score the prettiest goal of the All-Star Game so far."
