murray lehner

Goaltending is an integral part of the Stanley Cup Playoffs. To better understand the strengths and weaknesses of each goaltender, the last 100 goals allowed for each goaltender in the regular season were charted, with the help of Apex Video Analysis and Save Review System from Upper Hand Inc., to see what patterns emerge.

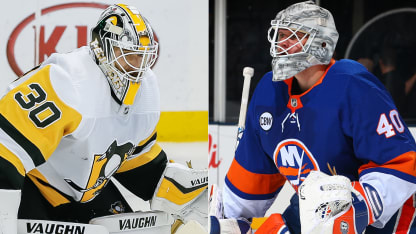
New York Islanders goalie Robin Lehner and Pittsburgh Penguins No. 1 Matt Murray each had a bounce-back season. Murray rebounded from a career-low .907 save percentage in his second full NHL season to post a .919 save percentage this season. Lehner overcame personal challenges to go from .908 last season with the Buffalo Sabres to .930 in his first season with the Islanders.
RELATED: [Complete Islanders vs. Penguins series coverage]
There were technical and tactical adjustments along the way, some of which show up in the goal trends that could play a role in deciding the Eastern Conference First Round. The best-of-7 series begins with Game 1 at Nassau Coliseum on Wednesday (7:30 p.m. ET; NBCSN, CBC, TVAS2, MSG+, ATTSN-PT).
Here is an in-depth look at each goalie's game:

Matt Murray, Pittsburgh Penguins

Two straight Stanley Cup championships to start his career should have been enough to give Murray a mulligan in a so-so first run as the Penguins start-to-finish No. 1 in 2017-18. So, his bounce-back performance this season should help answer any lingering questions.
After an up-and-down first half that included further injuries, Murray finished strong, including a .934 save percentage since March 2, to end his second season as Pittsburgh's starter with a 29-14-6 record, 2.69 GAA, .919 save percentage and four shutouts in 50 games.
While some of the goal trends behind those overall numbers have changed, a few remain the same.

Goal Trends

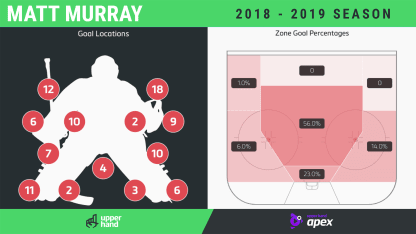
High glove: Nothing puts your game in the spotlight as brightly as a run to the Final, so there has been plenty of focus on Murray's glove early in his career, even when the totals weren't much higher than the average last season. The same held true this season, with 27 mid-to-high-glove goals just above the average (23.7 percent) recorded for more than 5,500 goals during the past three seasons of this project. However, with an additional 10 low-glove goals, slightly above the 7.8 percent average, don't be surprised if it's targeted again, especially since Murray dropped his left shoulder early in his career. He has tinkered with his glove position off and on while also getting attention for rebounds that pop out of it.

Murray Goalie Analysis

Seven hole:The number that should probably jump out a little more are the 10 goals under Murray's blocker-side arm, double the average (4.8 percent) and something that's been previously noted. Murray's blocker position, with his right elbow sticking out to keep the stick blade on the ice even in blocking situations, led to more goals under the arm and between the blocker in his first two seasons, and while they dropped last year, they're back up this season.
Clean shots: Murray was near or better than average on screens, deflections, rebounds, lateral plays and one-timers, but he allowed 34 goals on clean shots on which he had time to get set. That's above the 22.9 percent average and the highest tracked total this season. They accounted for five of the 10 goals under the blocker-side arm compared to 11 of 27 mid-to- high-glove, and for 23 of 44 rush goals. Some of this may be his tendency to retreat flat to the goal line on rush chances down the wing, which can cause him to lose squareness. There is a lowering and widening of his stance on these plays, which can leave him locked in a little early and makes it harder to react into shots.
Blocker side: Perhaps more surprising is the amount of goals scored from outside the home-plate area on Murray's right (14, compared to six on the glove side). This could be little more than facing more high-quality chances from his right, but that would require tracking every shot to create a save percentage for each zone. Murray was a rare goalie who moved better to his blocker side in the past, and while some of that early rotation into angle seems to have been lost, it's still surprising to see him get beat more from that side.
Robin Lehner, New York Islanders

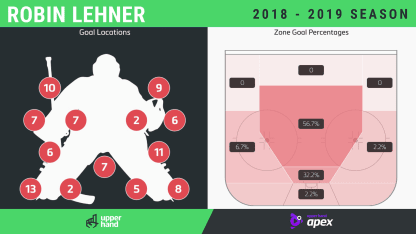
Lehner, who allowed 93 goals this season while splitting the starts with Thomas Greiss, was second among goalies who played at least 40 games in goals-against average (2.13) and save percentage (.930). He simplified his game with the Islanders, playing less aggressively even against rush chances, and improving the efficiency of his movements by continuously gaining angle as plays move into the zone rather than retreating flat along the goal line.
He hasn't totally abandoned the raw instincts he sometimes relied upon too much early in his career.

Goal Trends

Tips versus screens: Lehner has talked about how much better he is managing traffic with the help of a defense on the same page in terms of picking which side each is responsible. His numbers bear that out, with screens accounting for 12 goals (12.9 percent), well below the 21.2 percent average. His 22 deflection goals were slightly above average (20.3 percent), and 10 were against the grain, catching him moving in one direction while the puck was played in the other direction. It's easier said than done, but with Lehner playing deeper, shifting laterally into long shots, and sometimes relying on his big frame (6-foot-4) rather than keeping his hands active, it's worth a try and a factor in the 23 against-the-grain goals allowed (16.9 percent), his highest total above the tracked average.

Lehner Goalie Analysis

Sharp angles and second chances: Rebounds accounted for 25 of Lehner's goals (26.9 percent), one of the few scoring plays where Lehner was above the average (21.1 percent). Six came off the rush, so it wasn't a matter of shots off pads being kicked back out into the middle of the ice. The highest number of rebound goals (10) came off low-to-high plays from sharp angles and these types of plays were also a factor in nine other goals. Lehner has tightened and simplified his movement patterns and technical elements, but his exits from post play remain a work in progress. With the Islanders making it hard to get pucks to the net, sharper angles aren't a bad option.
Not a rush: Lehner has talked about a lack of rush chances being the Islanders biggest defensive improvement, and it shows up in two statistics: 30 rush goals allowed (32.2 percent), which is below the 41.6 percent average tracked this season, and 33 goals (35.4) on plays across the slot line.
Out of the box: Lehner won't hesitate to throw out an old-fashioned, two-pad stack coming across the ice on a second chance, an unpredictability that can make it harder to break down his game. But he sometimes lifts up while moving left after rebounds in anticipation of a high second shot, worth anticipating given it played a role in five of the 14 five-hole goals under the left pad.