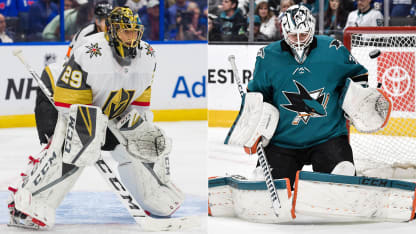
Fleury Jones Round 1

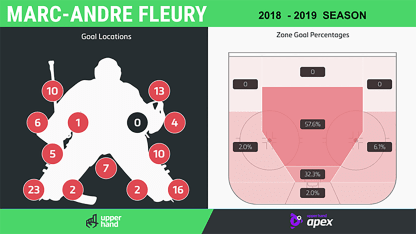
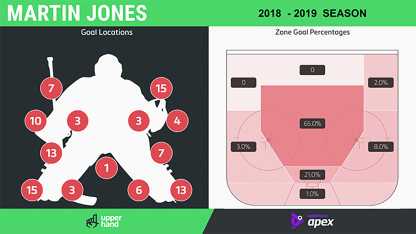
Goaltending is an integral part of the Stanley Cup Playoffs. To better understand the strengths and weaknesses of each goaltender, the last 100 goals allowed for each goaltender in the regular season were charted, with the help of Apex Video Analysis and Save Review System from Upper Hand Inc., to see what patterns emerge.

Vegas Golden Knights No. 1 goalie Marc-Andre Fleury and San Jose Sharks counterpart Martin Jones each saw their save percentage drop significantly this season although each finished in the top five in the NHL in wins. Style-wise, there are more differences than similarities between the two, but as they get set for a rematch of last year's Western Conference Second Round series (won by Vegas in six games), it may come down to which team best limits the types of chances that leaves their goaltender most exposed.
Game 1 of this best-of-7 series between the Golden Knights and Sharks will be played at SAP Center on Wednesday (10:30 p.m. ET; NBCSN, SN, TVAS2, NBCSCA, ATTSN-RM).
Here is an in-depth look at each goalie's game:

Marc-Andre Fleury, Vegas Golden Knights

After posting a career-best .927 save percentage in his first season with the Golden Knights and backstopping them to the Stanley Cup Final last season, the 34-year-old was back at his career average with a .913 save percentage this season. Although that included 35 wins (tied for fifth in NHL), eight shutouts (second) and a dominant six-game stretch before getting injured on March 15, there were also signs opponents were able to take advantage of the positional aggression that returned to Fleury's game under Golden Knights goaltending coach Dave Prior.

Goal Trends

Along the ice: The Washington Capitals successfully attacked Fleury with lateral plays in the Stanley Cup Final last season, and it seems other teams took notice. Fleury gave up 39 percent of his goals along the ice outside his skates, almost double the average of 21.3 percent among the more than 5,500 goals tracked for this project over the past three seasons. That may seem surprising given Fleury's explosive lateral mobility and quick-kick pads, but most of those goals were backdoor tap-ins and one-timers of cross-ice passes off the rush. Fleury may still be one the fastest goalies in the NHL, but playing consistently beyond the edges of his crease, both in terms of being above the blue ice and beyond his posts laterally, leaves more distance to cover when the puck is moved from one side to the other. The patient, stand-your-ground approach preached by Prior also shows up in Fleury's high-glove goals being way down over two seasons in Vegas, another reminder it's better to make him move than trying to beat him clean.

MAF

Cross-ice and quick releases:Fleury was above the average for goals along the ice last season, but only by 7.4 percent, and the increase appears tied to teams attacking cross-ice with quick shots. Thirty-nine percent of the goals coming on plays across the slot line, an imaginary line that splits the offensive zone in half from the goal line to the top of the face-off circles. And quick releases or one-timers accounted for 46 percent of the goals, well above the 37.6 percent average. The trend isn't isolated to rush chances, either. Fleury had the highest rush totals last year (49 percent, 10 percent above average), but it was down to 34 percent this season.
Mind the stick:Fleury has always been active and effective with his stick, whether with a poke check or to cut off passes, so opponents must be mindful when trying to create plays through his crease and from behind the net. But that habit can also leave him reaching past his posts, especially on the blocker side, and exposed to quick shots on pass outs, which accounted for several of the 19 percent of goals he gave up on low-high plays from below the goal line.
Dead angles: His post play improved significantly in his final seasons with the Pittsburgh Penguins, but playing outside his posts leaves him vulnerable to wraparounds off the rush, a play the Sharks used to score three goals on him in the playoffs last season.

Martin Jones, San Jose Sharks

Jones is a noticeably quieter positional goalie compared to Fleury, staying mostly within the edges of his crease, but even leaving himself shorter distances to travel on lateral plays wasn't enough in the face of the odd-man rushes San Jose surrendered in front of him. How much that contributed to an NHL career-worst .896 save percentage is beyond the scope of this study since it doesn't involve tracking all the shots that the 29-year-old faced, but the percentage of goals that came off odd-man rushes and cross-ice passes is a pretty good sign it wasn't all on the goaltender.

Goal Trends

Rush chances and lateral plays: Jones gave up 54 of his past 100 goals on rush chances, well above the 39.2 percent average over the past three seasons. Jones also gave up 41 percent of his goals on passes or plays across the slot line, which tend to be the toughest on a goaltender because he has to completely rotate and reset his angle and body position from one side to the other, and 28 came on rush chances. In other words, there was a lot of cross-ice passes on odd-man rushes that contributed to a tough season statistically and given the skill Vegas has in its forward group, limiting those types of chances will be important for San Jose.

Jones

Stretch him out:Jones gave up 17 breakaway goals, well above the average of 10.1 percent, and while we'd need to see how many breakaway chances he faced to get a save percentage, the successful attempts involved getting him moving. Whether it was the nine goals where the shooter pulled the puck across the slot line, or nine where they went against the grain with a shot or deke, getting him moving one direction and sending the puck the other way, the tendency was to open up and extend on wide plays rather than staying over his knees.
Against the grain:There aren't many extremes in any of Jones' charts, which isn't surprising given his neutral, well-balanced approach, but there were 24 against-the-grain goals, the second straight year he was well above the 16.9 percent average. Part of this can be explained by a tendency to either retreat or come across his crease flat, without full rotation into new angle, which doesn't let him square up as fast, if at all, and leaves the far side exposed. It's more pronounced moving to his blocker side and can also leave him stranded off his posts on rebound recoveries in that direction, each of which helps explain some of the additional goals from outside an already expanded and generous home plate area on his right side.
Traffic management:Jones gave up 18 screen goals, below the average (21.2 percent) and down from last season (23) but was caught at times retreating deep into his crease behind traffic and dropping directly behind the screening opponent rather than picking a side.