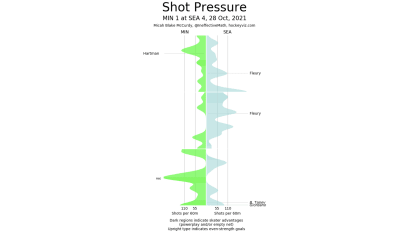
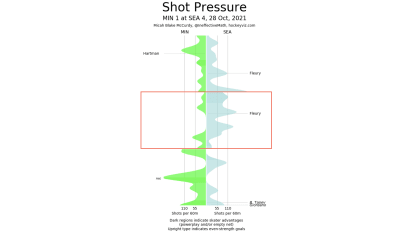
Going into Thursday's game against Minnesota, Hakstol had a few areas of improvement front of mind. Even though the Kraken won Tuesday's matchup versus Montreal, the head coach wanted to see his team play better in the middle frame of the game.
"We can clean up how well we execute with the puck, especially in the second period and make sure we're valuing that puck and taking care of things to give ourselves the best opportunity to play in the offensive zone instead of turn around and check 200 feet and play in our D-zone," Hakstol said Wednesday. "In our second period, there were periods where we were a little bit sloppy even though we had the lead."
Once again, what our eyes see matches what the data shows. The Kraken have been a strong second-period team all season. This is particularly impressive when you consider that the second period contains the "long change" when teams are skating greater distances to return to the bench for a shift change so it can be more difficult to maintain possession of the puck. In every game but two (Columbus and the aforementioned Montreal), in the middle 20 minutes Seattle has won the possession game and on the season as a whole, they've out-scored opponents 9-6.
Maintaining that kind of performance is obviously important and that's why Hakstol wanted to see a return to form. So, were the Kraken able to get back to their strong second-period play and can we see how it happened?
Let's dig in.
Spoiler alert, the Kraken did exactly what their head coach wanted them to do. According to NaturalStatTrick.com, in 5-on-5 play in the second period, Seattle fired off 77.78% of all shot attempts and 83.22% of all shot quality. That's a dominant performance. But we may have more questions: how did that go down? Did the Kraken's offense just take off? Did Minnesota's not? Was there some big burst of offense and that was it? Let's go a little deeper.
Raw numbers are certainly a great way to understand what happened, but we can also look at what happened in a game in terms of "pace," meaning, where were the ebbs and flows within a game and how do those relate to other ebbs and flows in terms of how big they were. To answer this question, sometimes, as they say, pictures are worth a thousand words.
For every NHL game, HockeyViz.com publishes a "shot tide." You can read more about this graphic
here
, but what it does is show a game from start to finish going from top to bottom with each team's shot volume (rated out per 60 minutes of play) against that time span. The farther each team's "tide" gets away from the middle, the bigger (or more) it's shot volume was. Goals, power plays, and pucks that hit the post are marked.
Let's look at the shot tide from the Minnesota game.


