A look at the game “by the numbers.”
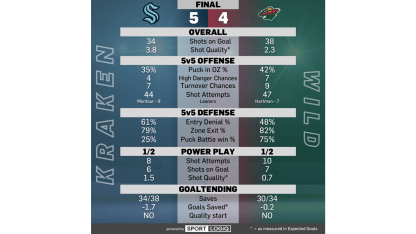
- In 5-on-5 play, Minnesota had an edge over the Kraken who generated 44.6-percent of all shot volume and 40-percent of all shot quality. But on the power play (of which each team had two opportunities), the Kraken generated more shot quality than their opponent (.98 expected goals as compared to .49 for the Wild).
- The best forward combination for Seattle was the line centered by Yanni Gourde, with Tye Kartye and Brandon Tanev on the flanks. They allowed as many shot attempts as they took in their 8:37 of ice time together and split the shot quality battle as well.
- Brandon Montour led his team and tied for the overall lead in individual shot attempts, (8, 5-on-5 play) while Jared McCann generated the most even strength shot quality for the Kraken.
- The Kraken generated two response goals – their first two of the season. The first, Jordan Eberle’s first score, came 46 seconds after Matt Boldy put the Wild up 2-0, and then Tye Kartye’s goal came 1:06 after a Kirill Kaprizov tally. Last season, when the Kraken scored a response goal (after an opponent’s goal), they had a 6-5 record.
- Seattle found its way net front as the game went on with 16 high-danger scoring chances to Minnesota’s 13 (all situations).
- The Kraken also created more looks off the rush with nine as compared to the Wild’s 5. All nine rush chances came in even-strength play.
- Andre Burakovsky led the Kraken in possession time in the offensive zone (:48) and slot shots (2, tied with Chandler Stephenson and Matty Beniers), while Montour tied with Beniers for most controlled zone entries (7). Beniers led in controlled exits with eleven.

