Vasilveskiy-Kinkaid 4-12

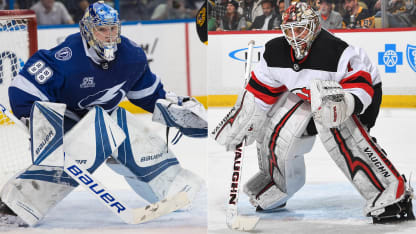
Goaltending is an integral part of the Stanley Cup Playoffs. To better understand the strengths and weaknesses of each goaltender, the last 100 goals allowed for each goaltender were charted, with the help of Double Blue Sport Analytics from Upper Hand Inc., to see what patterns emerge.
Tampa Bay Lightning No. 1 Andrei Vasilevskiy was the runaway leader for the Vezina Trophy as the NHL's best goalie the first half of the season before fading down the stretch. New Jersey Devils goalie Keith Kinkaid wasn't the starter on his own team to start the season, but finished strong, and moved ahead of Cory Schneider on the Devils depth chart.

RELATED: [Complete Lightning vs. Devils series coverage]
Now Kinkaid and Vasilevskiy meet in the Eastern Conference First Round, which starts Thursday with Game 1 at Amalie Arena (7 p.m. ET, SN, TVAS2, NHLN-US, SUN, MSG+).
Here is an in-depth look at each goalie's game:

Keith Kinkaid, New Jersey Devils

Kinkaid's statistics don't scream slam-dunk starter ahead of the more established Schneider, especially a .913 save percentage that is .001 above the NHL average. But Kinkaid, who was undrafted, was an underrated part of the run to the playoffs for the Devils, going 19-6-1 after Schneider was sidelined in late January with hip and groin injuries, and posting a .929 save percentage and NHL-leading 16 wins, tied with Connor Hellebuyck of the Winnipeg Jets, since Feb. 13.

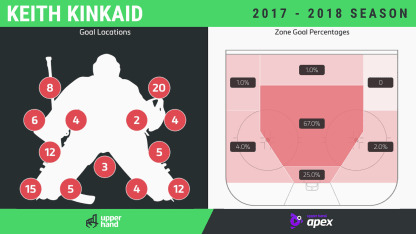
Kinkaid-graphic
Goal trends

High glove: The 20 high-glove goals jump out, but Kincaid's combined 24 mid- and high-glove goals are 1.4 percent lower than the average for the goals tracked in this project during the past two seasons. Kinkaid tends to pull up and off high shots on the glove side rather than closing down on them in front of him, which opens high areas of the net. It played a role in seven against-the-grain goals, where the puck or play is moving one way and shot or pulled back in the other direction, and seven clean-shot goals, where he had time to get set and could see the shot release before getting beat high to the glove-side.
Traffic and high point shots: Screens played a role in 25 percent of the tracked goals on Kincaid, and there were a couple notable trends. He does a great job taking away the bottom of the net with a wide butterfly base, but often dropped straight down behind the screen, a combination that left the upper parts of the goal open to shots that got through the traffic.
Rebounds around crease: Kinkaid gave up 23 percent of his goals on rebounds, which is less than two percent higher than the average. But it was the dispersion of those rebounds that was notable, with a lot of second chances around the crease off his softer pads. It shows up in the high goal totals along the ice on either side. It's also noticeably different than Vasilevskiy, with most of his 18 rebound goals from further out after coming off pads designed specifically to generate active rebounds. Each team will need to adjust where they search out second chances as a result.
Notable numbers: Just as pulling back with his torso plays a role in high-glove goals, it also contributed to the 12 low-blocker goals. That movement limits his ability to get the blocker to those shots.

Andrei Vasilevskiy, Tampa Bay Lightning

Vasilevskiy was spectacular through January in his first season as an NHL No. 1, and he finished with a League-leading 44 wins, a .919 save percentage and eight shutouts. Despite all that, the focus going into the playoffs is on his save percentage slumping to .902 since playing in the 2018 Honda NHL All-Star Game, and the need for a break to rest and reset down the stretch. Which Vasilevskiy the Lightning get in the playoffs will be key because they leaned heavily on the talented 23-year-old, who made the tough saves behind loose defensive play for long stretches.

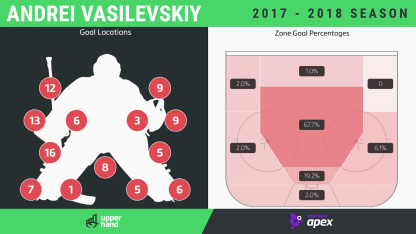
Vasilevskiy-graphic
Goal trends

Blocker side: Vasilevskiy's splits from glove to blocker sides are jarring, even if they aren't as representative in the way a save percentage would be. The mid- and high-blocker total of 25 percent is 7.6 percent above the tracked average during the past two seasons, but when you add the 16 low-blocker goals and six under the arm on that side, Vasilevskiy gave up 47 percent of the tracked goals over the pads on that side. That's 16 percent above average. What's behind it? Almost every goalie moves better to one side than the other and, for most, the blocker side is the weaker of the two. In Vasilevskiy's case, we can see some of the issues in his left-to-right movement in his biggest highlight-reel moments this season: Twice he spun around his upper body to glove shots behind his back while moving to his right. They were spectacular saves, but also a sign of increased counter-rotation. His lower body was moving one way and his upper body was twisting the other, a characteristic that is more prevalent in his left-to-right movement.While he's such an incredible athlete that he can still react from these positions, they are far from ideal.
Go high: Textbook or not, Vasilevskiy's explosive power and ability to tap into it, even when his body is already extended, is up there with the most athletic goalies in the NHL. As a result, it's no surprise he doesn't give up many goals along the ice outside his skates. His powerful pushes with long legs helps Vasilevskiy counter the tap-in goals that are usually a staple of scores from outside the skates.
Low shots in traffic: Vasilevskiy tries to find pucks at the point by looking above the traffic in front of his crease. The delay getting back down costs him on some low shots under the pads.
Notable numbers: Nine of the 100 tracked goals were from bad angles or below the goal line, a trend explained by a variety of factors. Vasilevskiy likes to put one skate on each post with the puck behind the goal, which takes away the entire bottom of the net but adds delays when moving off the posts, a factor in some of the 11 low-high goals allowed on passes originating from behind the net and into the slot.