Playoff Central
Playoff Tickets
2025 Stanley Cup Playoffs
Round 1
Devils vs. Hurricanes
Individual Playoff Tickets Are On Sale Now!
Friday, April 25 • 8 PM
2025 Stanley Cup Playoffs
vs. Round 1 Game 3
Sunday, April 27 • 3:30 PM
2025 Stanley Cup Playoffs
vs. Round 1 Game 4
Friday, May 2 • Time TBD
2025 Stanley Cup Playoffs
vs. Round 1 Game 6*
*if necessary

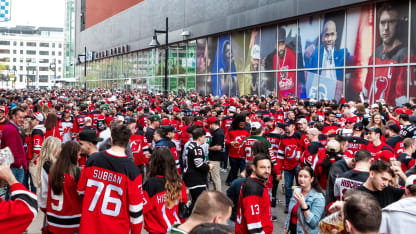


Home Game Festivities for 2025 Playoffs
Featuring new and exciting elements prior to each home game at Prudential Center! Starting with Fan Fest at Championship Plaza - 5 PM on Friday for Game 3 and 12:30 PM on Sunday for Game 4.
Broadcast Schedule
Round 1
Devils vs. Hurricanes
| Game | Date | Time (ET) | Location | Broadcast | Tickets |
|---|---|---|---|---|---|
| Round 1, Game 1 | Sun, Apr. 20 | 3 PM | Lenovo Center | MSGSN | ESPN, SN, SN360, TVAS | NJD 1, CAR 4 |
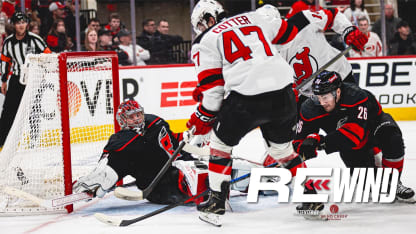
| Round 1, Game 2 | Tue, Apr. 22 | 6 PM | Lenovo Center | MSGSN | ESPN, SN360, TVAS2 | NJD 1, CAR 3 |
| Round 1, Game 3 | Fri, Apr. 25 | 8 PM | Prudential Center | MSGSN | TBS, Max, SN360, TVAS2 | Get Tickets |
| Round 1, Game 4 | Sun, Apr. 27 | 3:30 PM | Prudential Center | MSGSN | TBS, truTV, Max, SN, SN360, TVAS | Get Tickets |
| Round 1, Game 5 | Tue, Apr. 29 | Time TBD | Lenovo Center | TBD | Viewing Parties |
| Round 1, Game 6 | Fri, May. 2 | Time TBD | Prudential Center | TBD | Get Tickets |
| Round 1, Game 7 | Sun, May. 4 | Time TBD | Lenovo Center | TBD | Viewing Parties |
*if necessary
Radio broadcasts for all games will be available on the Devils Hockey Network streaming online and on NJ Devils + Prudential Center App.

Devils Playoff Sweepstakes
Enter the Devils Playoff Sweeps presented by Prudential for your chance to win daily prizes including two glass seats to Game 4 at Prudential Center!
Viewing Parties


Video Player is loading.

Devils Youth Foundation
Support Summer Sports. Get Kids Moving. Play On. Join the Devils in making a difference. Bid now on one-of-a-kind Devils gear and experiences or donate today!
About The Playoffs
Playoff Format
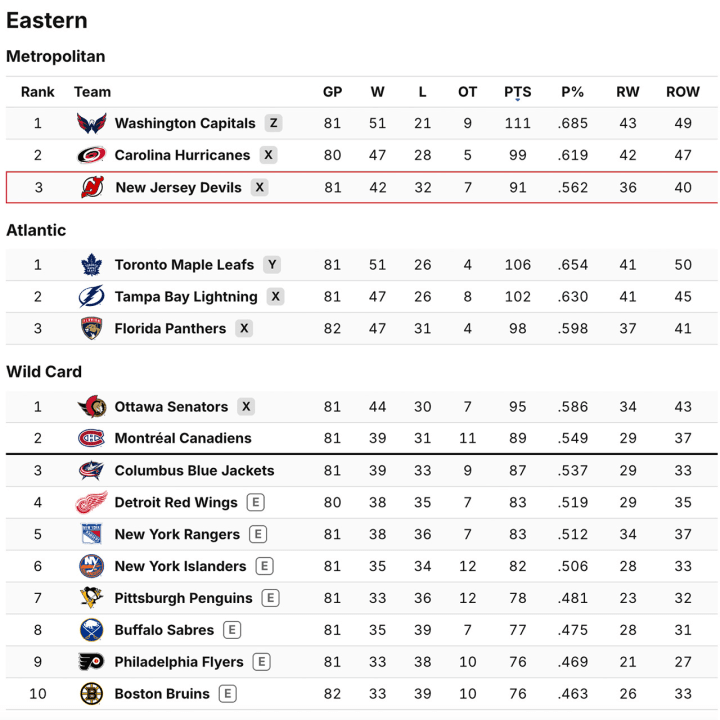
Playoff Picture
Points to Clinch
| Team | NJD Magic Number | Games Remain | PTS | Projected Points | Max Points | Regulation Wins | Max Reg. Wins |
|---|---|---|---|---|---|---|---|
 New Jersey Devils | -- | 1 | 91 | 92 | 93 | 36 | 37 |
 Montréal Canadiens | 0 | 1 | 89 | 90 | 91 | 29 | 30 |
 Columbus Blue Jackets | 0 | 1 | 87 | 88 | 89 | 29 | 30 |
 Detroit Red Wings | 0 | 2 | 83 | 85 | 87 | 29 | 31 |
 New York Rangers | 0 | 1 | 83 | 84 | 85 | 33 | 34 |
 New York Islanders | 0 | 1 | 83 | 84 | 85 | 28 | 29 |
What is the Devils Magic Number?
Current Standings